Concentrations of Galaxies & Quasars
To better understand this page one must read: The Essence of Time & Age of Universe
In the following set of pictures one can see the dependence of visible concentrations of galaxies and quasars from the conventional distance to object in the homogeneous Universe. It is supposed in this work that large clusters of galaxies are distributed uniformly in universe, but we can see non-homogeneous distribution because of the constant loss of information in the universe. As a result of losing of information, the universe has conventional and real ages, and conventional and real length of big circumference. The several cases of geometry are shown here.
One and the same galaxy in different time epoch is shown
as:

One and the same galaxy, situated on the different poles
of closed Universe, and with equal time readings is shown by:

Here is the case of closed Universe with identical opposite points. That is one and the same galaxy on both poles of Universe. (Imagine that on the Earth there is no Europe, Asia, Africa, but there are two America; there is no South Pole, but there is two North Pole.) On the bottom graph one can see the real (or invisible) distance between one and the same galaxy. On the middle graph one can see one and the same galaxy in time evolution and visible (or conventional) distances between "main solution" of galaxy and its "ghosts".
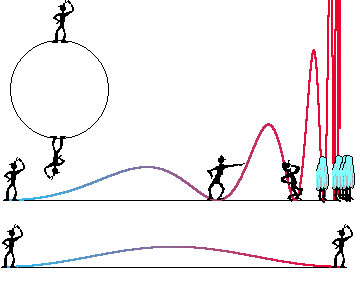
In this case we have the following values of red shift, zi,
for maximums of concentrations of galaxies and for minimums of concentrations
of quasars: z0=0.52, z1=1.82, z2=3.83,
z3=7.08...
and the following values of zj for minimums of concentrations
of galaxies and for maximums of concentrations of quasars, and other exotics,
such as supervelocities and so on: z1=1.11; z2=2.71;
z3=5.26; z4=9.40... It is clear that quasars are usual
galaxies, but we can see them near the poles of Universe, and consequently
they looks very brightly and can have extremely large dispersion of z because
of tangential red shift on the pole.
In the next picture one can see the closed Universe with non-identified opposite points.
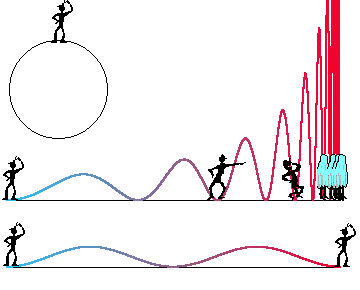
Maxims of galaxies concentration, minima of exotics: z(0)=0.252218; z(1)=0.79833;
z(2)=1.44554; z(3)=2.24179; z(4)=3.23975; z(5)=4.50320; z(6)=6.11201; z(7)=8.16745;
z(8)=10.7988... Multiple images of one and the same galaxy, for
example: z= 0.25; 1.44; 3. 24...;
From the opposite side of the sky we'll see the several more "ghosts" of
the same galaxy, but living in different time epoch: z= 0.79; 2.24; 4.50...
This is one more method to define the value of Hubble constant.
Minima of concentration of the galaxies, maxims of exotics. z(0)=0; z(1)=0.51573; z(2)=1.10632; z(3)=1.82195; z(4)=2.71189; z(5)=3.83373; z(6)=5.25868; z(7)=7.07657; z(8)=9.40175... If on the pole there is a dust or gas then we'll see the same absorption lines in all objects behind that pole. I have no statistics, but this is one more method to define the value of Hubble constant.
One more interesting case: One and the same observer is on the poles of the closed Universe, and is extended on equator. It is possible that time pole corresponds to space equator in this model.
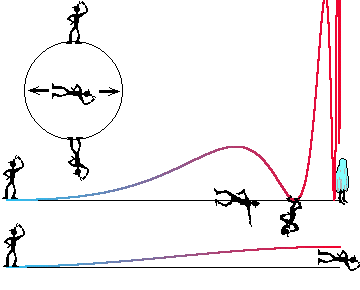
In this case we have the following values of red shift, zi, for maximums of concentrations of galaxies and for minimums of concentrations of quasars: z1=1.82, z2=7.08... And the following values of zj for minimums of concentrations of galaxies and for maximums of concentrations of quasars, and other exotics, such as supervelocities and so on: z1=2.71; z2=9.40...
One of exotic cases is shown here. You can see the observer in this case only after two round world trip about this model. In the general case one and the same observer can be find only in one of n images of this model. This model is hard one, but our Universe, with it's clusters, groups of galaxies, is not much simpler. This model has many exotic consequences, for example: Our Sun can be situated in many observable galaxies... We live in Milky Way, in Andromeda, and in some others galaxies, simultaneously...
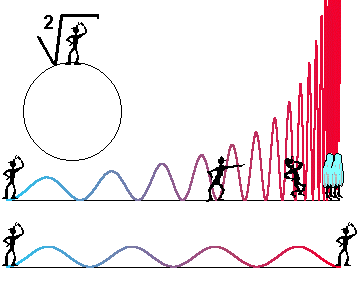
Here there is a figure containing all upper graphs together. At the right side of this figure there are galaxies-littlemen with synchronized watches. The evolution pictures will be quite different.
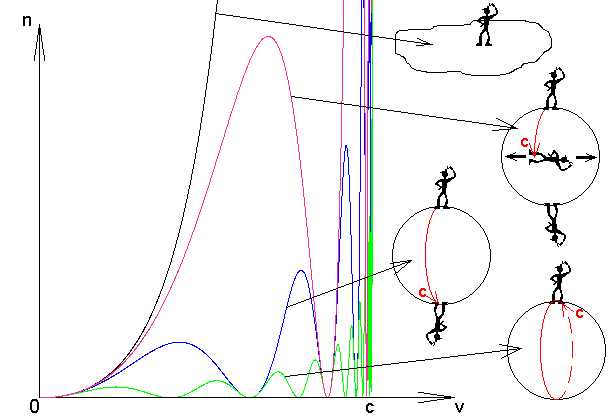
The green graph is the most appropriate to observational dates and to the matter density and to CBR temperature, calculated in this work.
To index of Space Genetics,
Last updated: 17 February 2002 by Ivan Gorelik